 FoodIdentifier
Food Analyzer: How AI Reads Your Plate (And Where It Gets It Wrong)
A food analyzer reads a photo of your meal and estimates calories and protein. Here's how it really works, what it sees, and where it still gets it wrong.
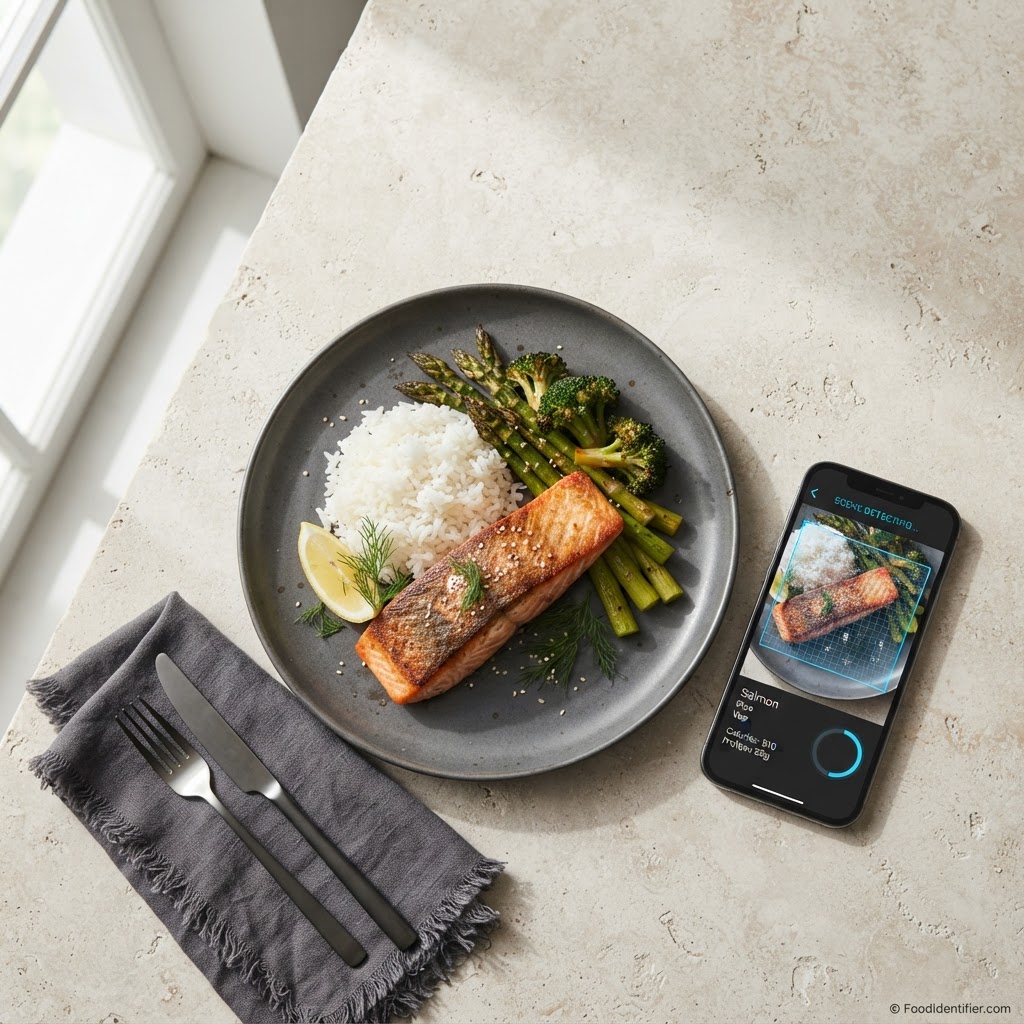
Scan any plate free at FoodIdentifier.com — calories and macros in seconds, no app, no sign-up.
Key takeaways
- ▶A food analyzer turns one plate photo into an estimate — calories, protein, carbs, and fat — in seconds, with no typing, no searching, and no database homework.
- ▶It works in five steps: photograph the meal, recognize the foods, estimate the portions, match each food to reference nutrition data, then add it all up. Every step can be a little wrong, and the errors compound.
- ▶Portion estimation is the hard part — not recognition. A camera can tell salmon from chicken easily; guessing how many grams of salmon are on the plate is where the error lives.
- ▶It\u2019s best at plain, visible foods — grilled salmon, rice, eggs, a banana — and weakest at sauces, oils, and mixed dishes where the calories hide underneath.
- ▶Treat the number as a good estimate, not a measurement. For a food you eat daily, a scale still beats any camera. For a whole restaurant plate, the camera wins on speed — and speed is usually the difference between checking and not checking.
No app download, no sign-up, no card. Point your phone at the plate in front of you and see the calories, protein and carbs in about five seconds.
Scan a food free — no app, no sign-up →What a food analyzer is — and what it isn't
A food analyzer is software that looks at a photo of food and estimates what's in it: the foods it can identify, roughly how much of each, and the calories and nutrients that amount would contain.
It helps to separate it from its close relatives, because the names get used loosely:
- ▶A food analyzer works from a photo of a meal or a plate. Its job is decomposition — break the picture into foods, size each one, total the nutrition.
- ▶A food scanner usually works one item at a time: a barcode, a packaged product, or a single food. Narrower input, narrower answer.
- ▶A calorie counter app is a diary first. You search, pick an entry, type a portion, and it adds it to your day. The intelligence is in the database and your patience, not in a camera.
A food analyzer is not a lab test. It doesn't chemically analyze your meal, doesn't know your recipe, and can't see inside a burrito. It also isn't magic, whatever the app-store screenshots imply. It's pattern recognition plus a nutrition database — and both halves have limits, including our own scanner's, which I build.
It is also not a medical tool. If you dose insulin off carb counts or manage a condition where a wrong number has consequences, an estimate from a photo is information, not a measurement you can act on. Talk to your doctor or dietitian about what level of precision your situation actually needs.
I wrote this because people are clearly asking. In Google Search Console data checked in October 2026, "food analyzer" and its British spelling "food analyser" drew 382 impressions between October 2 and 29 at around position 75 — page seven or eight — with no post on our site actually explaining the term. Here's the straight answer, not the marketing version.
How a food analyzer works, step by step
Step 1: You take the photo. One overhead shot, decent light. The clearer the plate, the better everything downstream works. A dark, angled photo of a stew is where bad estimates are born. This step sounds trivial and isn't — the analyzer can only reason about what the camera captured, and a photo taken at a slant hides the height of every pile on the plate.
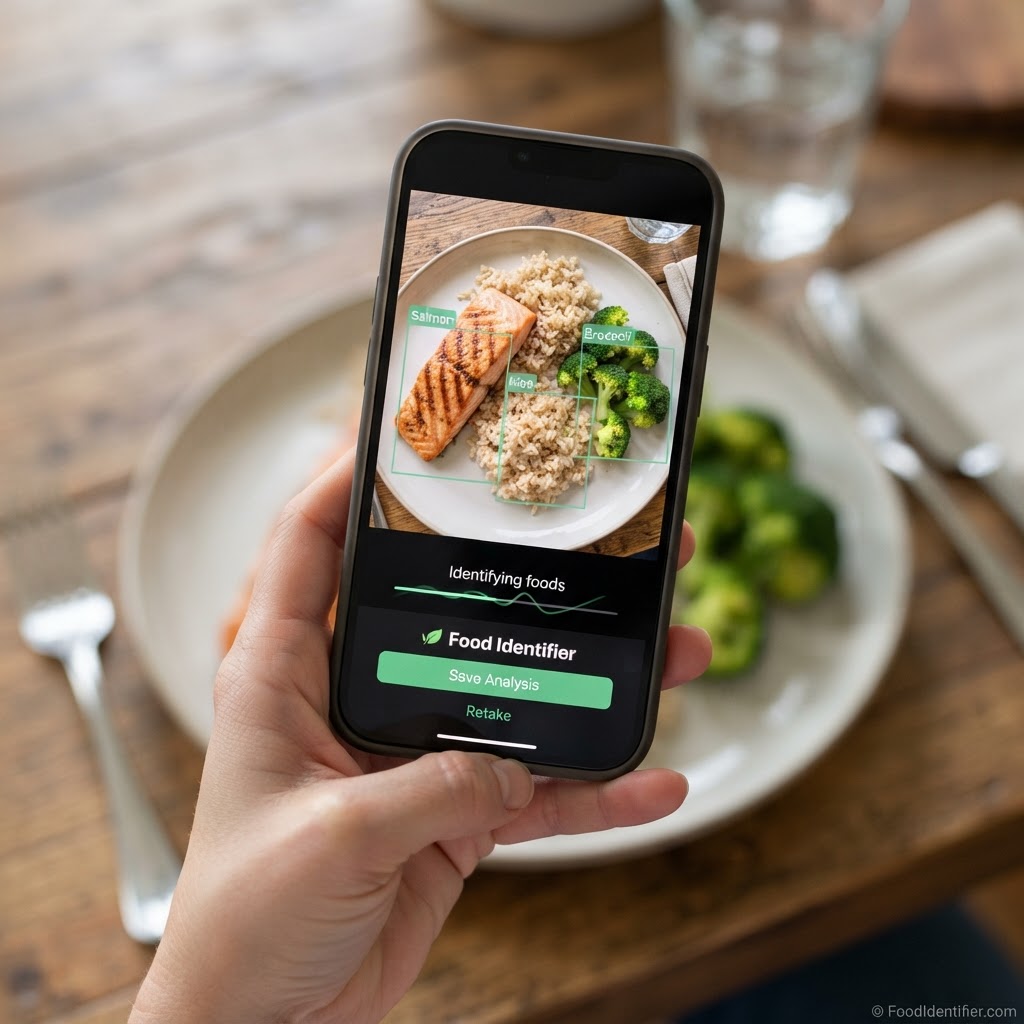
Step 2: The model identifies the foods. A vision model trained on large numbers of food photos labels the regions of your plate — that's salmon, that's rice, that's broccoli. Single, distinct foods are easy; a modern model has effectively seen every common plated food thousands of times. A casserole, where six ingredients have melted together, is not easy at all, and honest tools know it.
Step 3: It estimates portions. This is the hard part, and nobody markets it honestly. A photo is flat, so the model infers depth and volume from the plate's size, the height of the pile, and what a typical serving looks like. An educated guess — decent for a flat fillet, shakier for a heaped bowl. This step gets its own section below, because it deserves one.
Step 4: It matches each food to nutrition data. Every recognized food and estimated portion gets matched against per-100-gram reference values — the same kind of numbers you'd find on a label or in a national food database. The matching step matters more than people think: "chicken" can mean raw, roasted, fried, skin-on, or skinless, and those are different foods nutritionally. Even a single fruit varies — our calories in a banana answer shows how much one banana swings by size alone.
Step 5: You get the total. Calories, protein, carbs, and fat, in seconds. Our food analyzer does exactly this from a photo, free, in your browser — no app to install and no account to create.
"Crispy Does NOT Mean Healthy" — a real scan from our YouTube channel.
Watch that video for the honest version of the pitch: a crispy coating looks innocent in a photo, and breading and frying oil are exactly what change the real number. The scan is a starting point. Your eyes still matter.
Portion size: the genuinely hard part
Ask anyone who builds these tools where the error comes from and you'll get the same answer: not the recognition. Telling rice from mashed potato is mostly a solved problem. Telling 150 grams of rice from 250 grams of rice, from a flat photograph, is not.
Here's why. A photo gives the model a two-dimensional surface. Portion weight lives in the third dimension — depth — which the camera never directly measures. So the model cheats, the way you would: it uses reference points. The plate itself is the biggest one. A standard dinner plate is a known size, so a fillet covering a third of it has a rough footprint. Utensils, a hand in frame, a standard bowl shape — all of these anchor the scale. Then the model estimates the height of each food from shading, edges, and what that food usually looks like when served, and converts footprint-times-height into a volume, and volume into grams using what it knows about that food's density.
Every link in that chain is a guess layered on a guess. Cooked rice heaped in a dome and cooked rice spread flat can be the same weight and photograph completely differently — or different weights that photograph the same. A shallow bowl and a deep bowl look identical from directly above. This is why two honest analyzers can scan the same plate and land noticeably apart, and why one analyzer can be close on your grilled chicken and way off on your curry: the flatter and more separate the food, the more truth the photo contains.
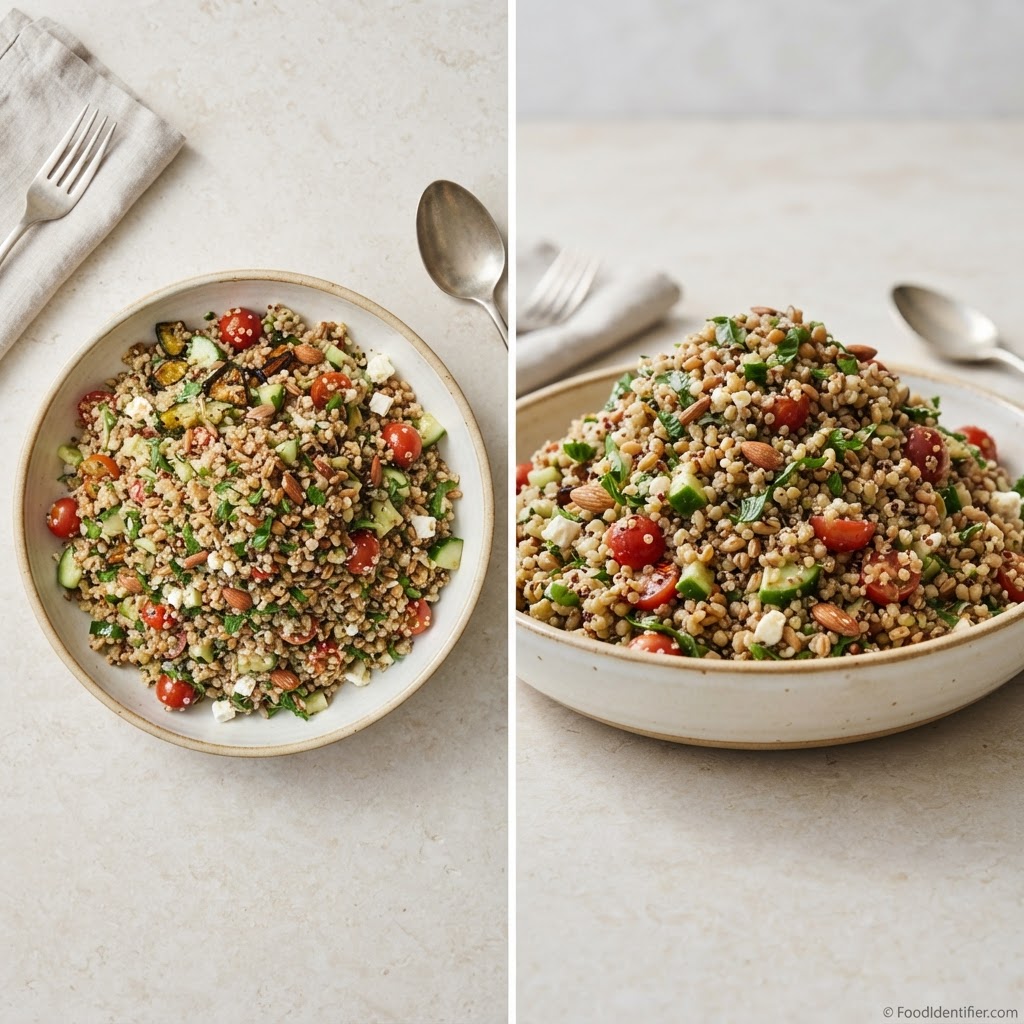
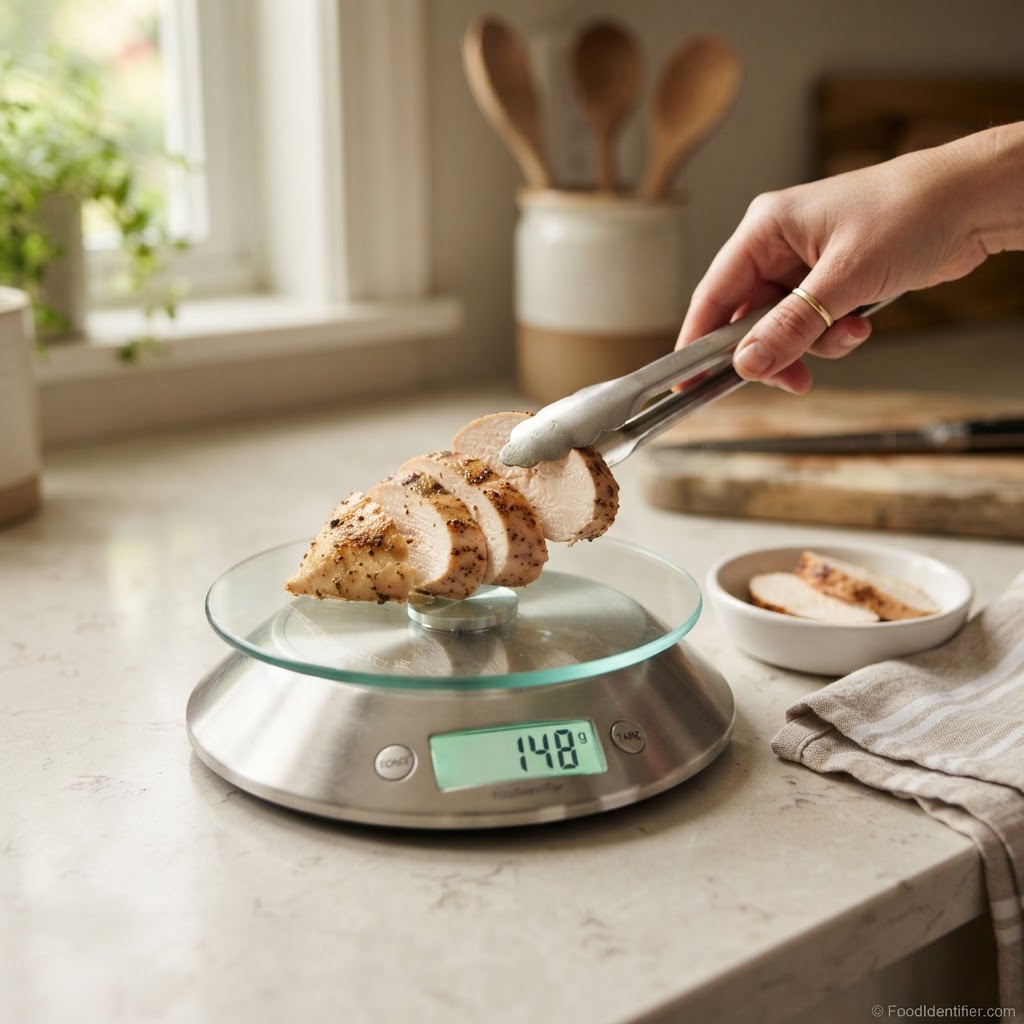
Practical consequence: if a meal matters enough that you need the number tight — a staple you eat five days a week, a recipe you're costing out — weigh it once, properly, and let the photo handle everything else. The analyzer's job is the ninety percent of eating that will never touch a scale.
Where the numbers come from: the database underneath
Once the model has named a food and guessed a weight, it needs numbers to attach. Those numbers don't come from the photo. They come from reference databases, and the backbone of almost all of them is the USDA's FoodData Central — the US government's published nutrient profiles for thousands of foods, measured per 100 grams: calories, protein, carbs, fat, fiber, sodium, and more.
The matching works like this. The model decides your photo shows grilled salmon. The database holds a reference entry for salmon, cooked, with its per-100-gram values. Your estimated portion — say the model settled on roughly a palm-and-a-half of fish — gets scaled against that entry. Portion times reference value equals your result. Do that for every food on the plate and add them up.
Two honest complications. First, reference entries are averages. The database's salmon is a composite of tested samples; your salmon is one specific fish, cooked one specific way, and it will differ a little. Second, the match itself is a choice. Cream in the sauce, skin left on, a sweetened glaze — each nudges the food away from the plain reference entry it got matched to, and the analyzer often can't see the nudge happen. None of this makes the numbers useless. It makes them what they are: the best standardized estimate available without a lab, built on the same reference data dietitians and food labels start from.
What it actually sees in your photo
It sees color, shape, texture, and context. It can tell rice from mashed potato most of the time, a fried egg from a boiled one, and often spot cooking clues — char marks suggest grilling, a glossy sheen suggests oil.
It does not see weight, ingredients cooked into a dish, sugar dissolved in a sauce, or butter melted into mashed potatoes. And it definitely does not see the second helping you went back for. Everything it reports is an inference from a surface, and surfaces lie politely.
That gap — between the surface and the substance — is the whole story of this technology. The rest of this article is really about managing it honestly.
A real scan, walked through step by step
Let me show you what actually happens, using a meal I scanned while writing this: a chicken burrito bowl from a fast-casual place near my office in Dallas. Rice, grilled chicken strips, black beans, corn, shredded cheese, pico de gallo, and a green sauce over the top. No tortilla. It looked like the "light" choice. It usually isn't.
The photo. Overhead, in the bowl, decent light from the window. Good input — everything on the surface is visible and separated into rough zones, which is the easiest case a mixed dish can offer.
The recognition. The analyzer split the bowl into regions and labeled them: white rice, grilled chicken, black beans, corn, cheese, tomato-based salsa, green sauce. All correct. This is the part of the pipeline that's genuinely good now — distinct, visible foods in their own areas are close to a solved problem.
The portions. Here's where it worked harder. The rice covered the largest footprint and sat underneath everything — and food underneath is food partly hidden, so the model estimated the bowl's depth from its rim and typical serving shape and landed on a generous-but-not-huge rice portion. The chicken strips on top were easier: separate pieces, countable, each a fairly standard size. The cheese and the green sauce were the shakiest estimates — both thin layers spread wide, where a small depth error becomes a big gram error.
The matching. Each food went to its reference entry: cooked white rice, grilled chicken breast, cooked black beans, sweet corn, shredded cheddar-style cheese, salsa, and a tomatillo-style sauce. Reasonable matches. The one I'd argue with is the chicken — fast-casual chicken is often thigh meat, marinated and cooked in oil, and "grilled chicken breast" is the leaner reference. The analyzer picked the plainer entry because the photo can't show a marinade.
The total. The bowl came back in the high hundreds of calories — roughly double what I'd have guessed before I built these tools, with protein carrying the meal and the rice-plus-sauce combination doing most of the calorie damage. Was the exact figure right? Unknowable without weighing a twin bowl ingredient by ingredient, which defeats the point. Was it useful? Completely. The direction was right, the ranking of the components was right, and the lesson — the sauce and the rice base are the meal, the chicken is the garnish, nutritionally speaking — is the thing I actually needed to know.
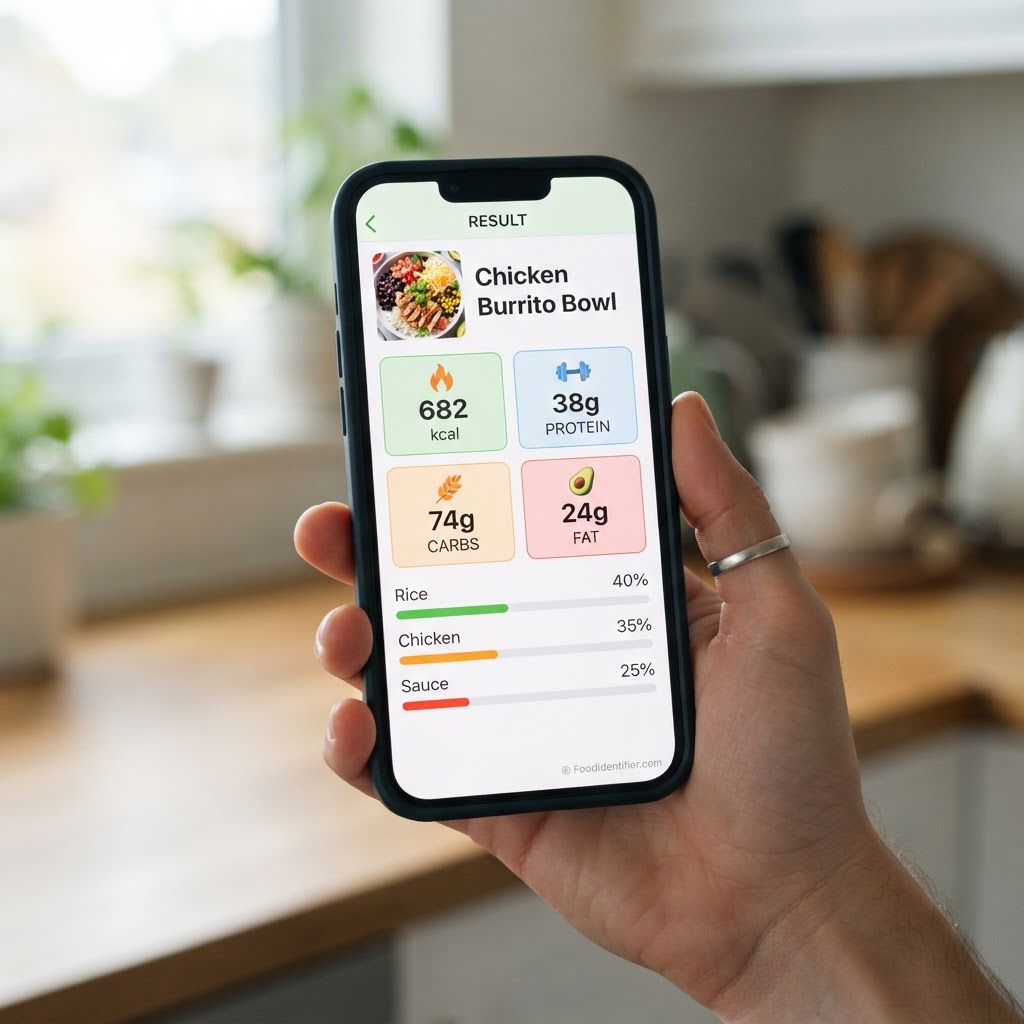
That's the honest case for the tool in one bowl: not a lab number, a fast correction to a confident wrong guess.
Where it gets it wrong — honestly
- ▶Sauces and oils. A tablespoon of oil is roughly 120 calories and nearly invisible once tossed through pasta or salad. This is the biggest source of underestimates, in our scanner and everyone else’s.
- ▶Mixed dishes. Lasagna, curries, stir-fries, casseroles — layered foods hide their ingredients and ratios. The model guesses the recipe; yours isn’t standard.
- ▶Portion depth. Shallow and deep bowls photograph almost identically from above. Heaped versus flat can swing an estimate by a third or more.
- ▶Look-alike foods. Regular versus diet drinks, full-fat versus low-fat cheese, sweetened versus plain yogurt — visually identical, nutritionally different.
- ▶Our own scanner, specifically: FoodIdentifier has the same weaknesses. It will underestimate a heavily sauced dish and can’t know your homemade recipe. What it does well is speed and direction — it’ll tell you in seconds that the “light” lunch is probably 700 calories, not 400, and that correction is where the value is.
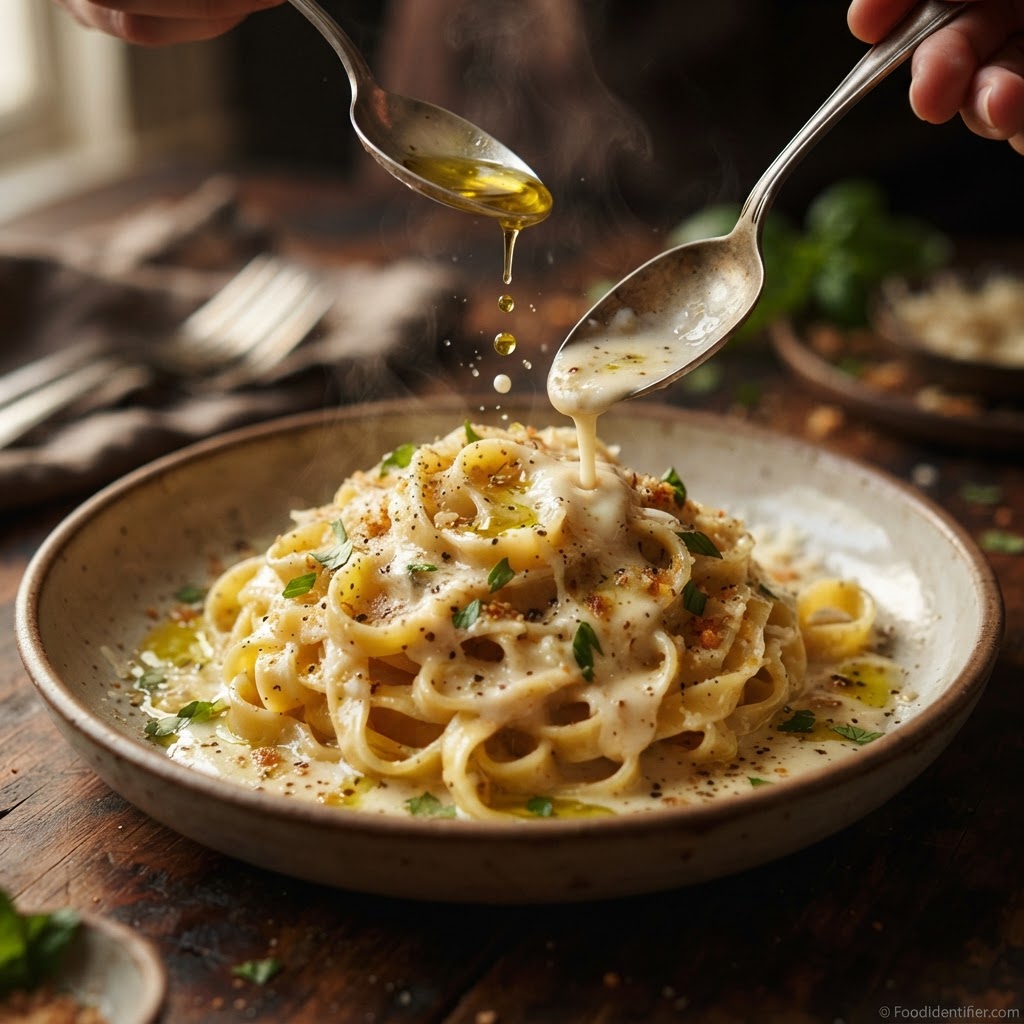
Put in one table, here's how reliability actually breaks down by what's on the plate:
| What’s on the plate | What the analyzer can see | Honest expectation |
|---|---|---|
| Single plain foods — grilled fish, eggs, fruit, plain rice | The whole food, clearly, in standard shapes | Strong — this is the tool at its best |
| Plated meals with separate components | Each food visible; depth estimated | Good — direction and ranking trustworthy, totals approximate |
| Packaged food photographed or scanned | The product, matched to its label data | Strong — the numbers come from the label itself |
| Sauced, layered, or mixed dishes | The surface only; recipe guessed | Weak to fair — expect underestimates; hidden oil is the main culprit |
| Anything where the recipe is yours alone | A dish that resembles a standard version | Fair at best — your version isn’t the reference version |
If a tool promises laboratory accuracy from a phone photo, it's selling. Every honest builder in this space knows the error bars are real.
The label problem: most food has no label
It's worth asking why anyone needs a photo estimate at all, when packaged food already prints its numbers. Because the printed numbers cover a shrinking share of what people actually eat — and because even shoppers who care are already reaching for their phones. NielsenIQ reports that 25% of shoppers now scan foods with apps, up from 17% — scanning has become a normal grocery habit, not a hobbyist quirk.
But a label only exists on a package. The meals that decide whether a diet works — the restaurant plate, the office catered lunch, your own cooking, your grandmother's cooking — have no label, no barcode, and no entry anyone typed in. You can weigh them (you won't, at a restaurant), you can guess (people underestimate restaurant meals badly, in study after study of plain human guessing), or you can photograph them and take a structured estimate built on reference data. That's the entire reason food analyzers exist. They serve the unlabeled majority of real eating.
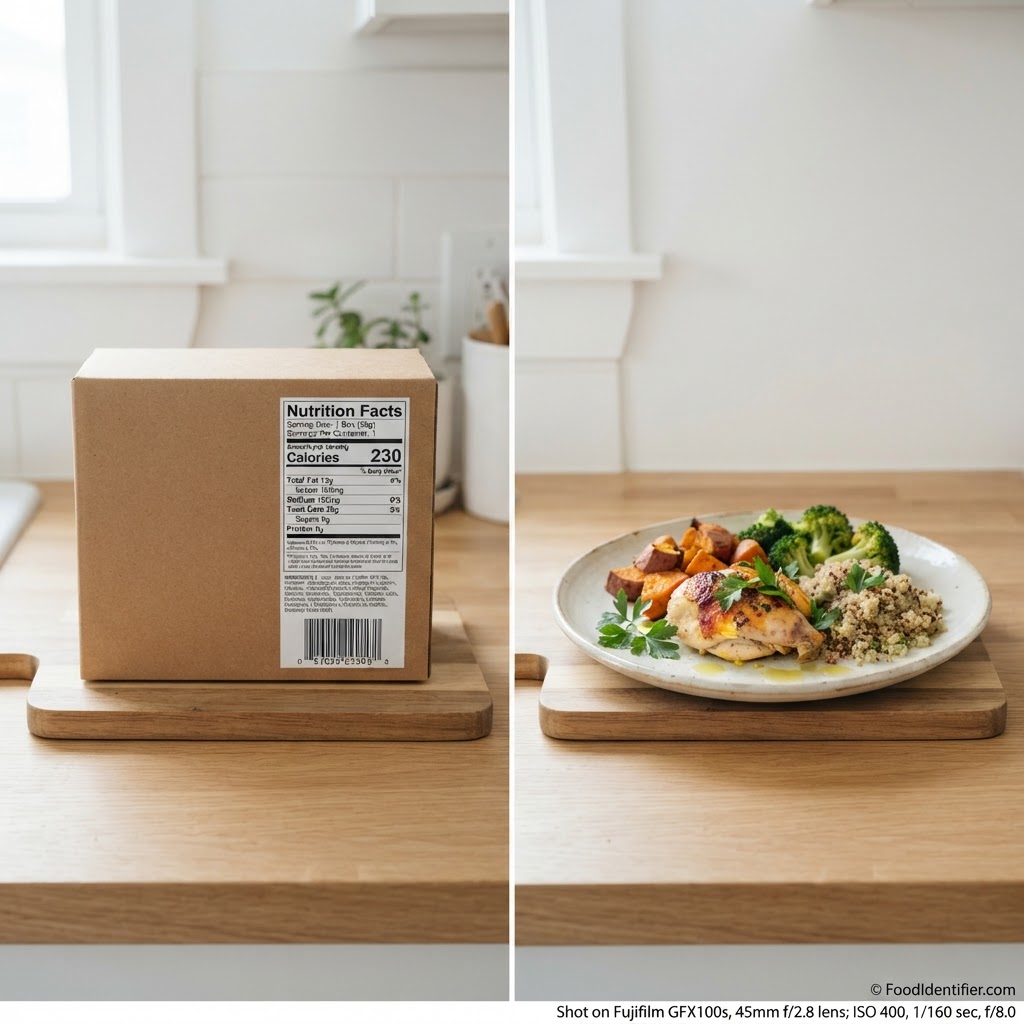
Scan a food free — no app, no sign-up — and see what the analyzer sees: calories, protein, carbs and fat in seconds.
Scan a food free — no app, no sign-up →How I compared the methods below
This post compares approaches — analyzer, scanner, counter app, and the kitchen scale — not brands. Here's how I judged them:
- ▶Speed — typical time from “I want a number” to having one, measured on a normal mixed meal, not a banana.
- ▶Effort — how much typing, searching, weighing, or second-guessing each method asks of you per meal, because effort is what kills tracking habits.
- ▶Cost — what you actually pay: free, freemium, a subscription, or hardware on your counter.
- ▶Best-case accuracy — what each method achieves when used carefully and correctly, stated qualitatively. Any specific percentage claim about a product’s accuracy needs lab validation behind it, so this table uses honest ranges of expectation instead.
- ▶Failure mode — what specifically goes wrong when each method misses, because every method misses somewhere.
Full disclosure: I build one of the tools in this category. The comparison uses the same criteria for it, and its drawbacks are stated in its row and throughout this article.
Food analyzer vs. food scanner vs. calorie counter vs. the scale
A note on names first: "food analyzer" and "food scanner" overlap in conversation — a scanner usually focuses on a single item or label, an analyzer on a whole plate. I compared the actual scanner apps head-to-head in our best AI food scanner apps guide, and our guide to identifying food by picture goes deeper on how the recognition itself works.
| Method | Time per meal | Cost | Accuracy, used carefully | Best for |
|---|---|---|---|---|
| Food analyzer (photo of a plate, e.g. FoodIdentifier) | ~5–15 seconds | Free at foodidentifier.com | Good estimate; portion and sauce errors are the main risk | A whole mixed plate, restaurant meals, a fast reality check |
| Food scanner (single item / barcode / label) | ~5–20 seconds | Usually free / freemium | Strong for packaged foods with labels; weaker on loose, cooked foods | Packaged snacks, drinks, and single ingredients |
| Calorie counter app (manual search and log) | ~2–5 minutes | Free tier / paid premium, varies | Only as good as the entry you pick and the portion you type in | People who eat repeatable, loggable meals and like a history |
| Manual weighing and logging | ~5–10 minutes | Kitchen scale, roughly $10–15 one-time | The most accurate home method, if you weigh everything including oils | One staple food you eat daily and want nailed down |
- ▶Food analyzer \u2014 best for whole plates and eating out. Drawback: it’s an estimate, and hidden fats are its blind spot — ours included.
- ▶Food scanner \u2014 best for packaged food with a label to read. Drawback: a label scan tells you about the package, not the portion you actually served yourself from it.
- ▶Calorie counter app \u2014 best for routine and history. Drawback: the friction is real — searching, picking between twelve near-identical entries, and typing portions three times a day is where most logging habits die.
- ▶Manual weighing \u2014 best for precision on repeat foods. Drawback: you will not weigh a restaurant meal or a friend’s cooking. The most accurate method is useless in exactly the situations where you most need a number.
Questions people ask before trusting one
“If it can be wrong, why use it at all?”
Because the alternative for most meals isn’t a scale — it’s a pure guess, or not bothering. A roughly right photo estimate beats a wildly optimistic guess, which is what unaided guesses about restaurant food usually are.
“Will it replace my calorie app?”
For a lot of people, it replaces the meals they never logged anyway — restaurants, buffets, other people’s cooking. If you love your app’s history and streaks, keep it, and scan the meals it can’t handle.
“Is my photo kept or shared?”
Ask every tool this, including ours. Check the privacy policy before you upload \u2014 and if a free tool won\u2019t tell you plainly what happens to your images, don\u2019t use it.
“Can’t I just read the label?”
When there is one, yes — labels are the best data source there is. But most food that causes trouble has no label: it’s cooked, mixed, sauced, or served by someone else. That’s the exact gap a food analyzer fills, and the section above on the label problem covers it in full.
“Isn’t this just for people on diets?”
It’s for anyone who has ever looked at a plate and wondered. Weight loss is the most common reason, but the same scan answers “is there decent protein in this?” for someone training, or “how much sugar is in this sauce?” for someone just trying to eat with their eyes open.
Who a food analyzer is for — and who should skip it
- ▶You eat out a lot: the food analyzer. A photo is the only method that survives a restaurant, a food truck, or a work trip.
- ▶You eat mostly packaged food: a scanner or a label check is enough, and it’ll be precise. You don’t need plate analysis for a life of barcodes.
- ▶You\u2019re tracking seriously for a goal: combine methods — weigh your repeatable home staples, scan everything else. Precision where it’s cheap, speed where it isn’t.
- ▶You\u2019ve quit three logging apps: the lowest-friction method you’ll use daily beats the perfect method you abandoned by Thursday. That’s the photo.
- ▶You should probably skip it if your eating is already simple, weighed, and working — don’t fix a system that isn’t broken. And skip relying on it if you need clinical precision: managing diabetes medication around carb counts, or recovering from an eating disorder, where a dietitian’s guidance — and sometimes not tracking numbers at all — is the right call. A photo estimate is a consumer tool, not a medical instrument, and I’d rather tell you that than sell you a scan.
Scan a food free — no app, no sign-up — and get a structured estimate for the plate in front of you.
Scan a food free — no app, no sign-up →Scan from a Photo →FAQ
About the author
Faisal Ali — Founder of FoodIdentifier
Faisal Ali is the founder of FoodIdentifier, the free AI food scanner at foodidentifier.com. He builds and writes about food transparency tools from Dallas, Texas, and started FoodIdentifier after realizing the foods with no labels — restaurant plates, home cooking, takeaways — were the ones nobody could check.
Related reading: best AI food scanner apps and the guide to identifying food by picture.
Connect with Faisal on LinkedIn →This article is general information, not medical advice. Nutrition estimates vary by portion, preparation, and brand.